IPS Server monitoring
There are several ways of using web requests to access information about IPS Server machine status and performance.
IPS Server status requests using the Server Monitor port
HTTP requests can be made at port 81 of each IPS Server machine:
http://{server FQDN}:81/servicemonitor
(This port is always HTTP and it does not give access to any user data.)
If the server is 'healthy', the response to this request will be an HTTP status code 200 and the text 'Success' in the response body.
For these requests to work outside the local Windows domain of the cluster, port 81 must be set open for inbound traffic at all firewalls and at the load balancer.
The status of the IPS Server machine, or machines in a cluster, which is displayed in the 'Service' screen of IPS Manager, can also be queried via the monitor port. Use an HTTP request to the 'servicemonitor' of the IPS Server machine, or to the load balancer address for a cluster. For example:
'http://ips.mycompany.com:81/servicemonitor/getStatus?server=ips-server-03.mycompany.com'
Note that the parameter value for 'server' should exactly match the server name(s) shown in IPS Manager.
The status value will be one of:
- Running
- Stopped
- Initializing
- Being Added
- In Maintenance
- Started With Error
- Not Responding
By default, the monitor port number is 81. This can be changed in IPS Manager, 'Service' screen, in the 'Endpoints' section. (See Service configuration.)
IPS Server status using the PowerShell module
The IPS PowerShell module cmdlet 'Get-ServerList' provides another means to access the server status information. For example:
PS> Connect-IPSManager https://ips.mycompany.com
IsSuccess : True
Errors :
Url : https://ips.mycompany.com
ServerVersion : 16.3.203.68
UserName : MYCOMPANY\ipsadmin
IsMemberOfAdminGroup : True
IsServerLicensed : True
PS> Get-ServerList
Address : ips-server-01.mycompany.com
Status : Running
IsPrimaryServer : True
Version : 16.3.203.29
IsVersionValid : True
Address : ips-server-02.mycompany.com
Status : Running
IsPrimaryServer : False
Version : 16.3.203.29
IsVersionValid : True
Address : ips-server-03.mycompany.com
Status : Running
IsPrimaryServer : False
Version : 16.3.203.29
IsVersionValid : True
You need to run the 'Connect-IPSManager' cmdlet only once to establish a connection to the IPS Server.
For more information about the PowerShell module, see IPS PowerShell module (Automation cmdlets).
IPS Server monitor
For version 16.5 Update 13 and later: the service setting 'Enable Server Monitor' (with default enabled) can be used to disable the server monitor processes. This means that all back-end data collection and API endpoints will be stopped; and the Server Monitor user interface in IPS Manager will be removed. This setting is useful when IPS/Planning Space is deployed in an IT environment, such as a cloud platform, where comprehensive server monitoring systems are already available.
IPS Server monitor is a graphical web-based interface to access live and historical performance data for IPS Server machines. You can open it by clicking 'Server monitor' in the left-hand menu of IPS Manager. It opens in a new browser tab.
The Server Monitor interface can be accessed directly using the URL 'http://{server FQDN}/monitor' (or 'https' if enabled).
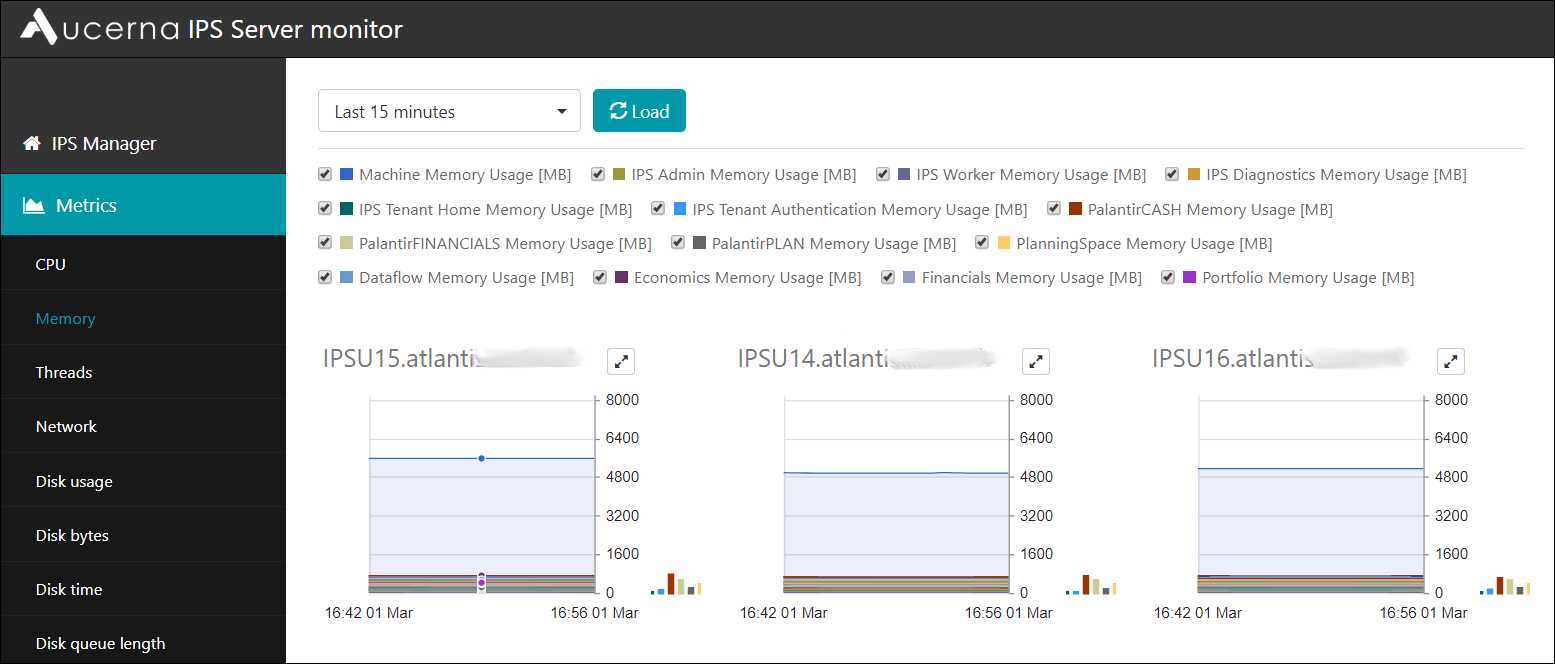
There is a graph view for each IPS Server machine. The machine name appears above the graph view.
Note: Graph views do not appear for server machines that are not in a Running state.
You can select which performance metrics are displayed by clicking the metric category in the left-hand menu ('CPU', 'Memory', 'Threads', and so on). The table below shows all of the performance metrics that are available. In the case of CPU, Memory and Threads, the data contain a machine metric for total usage (e.g., 'Machine CPU Usage') and metrics for the usage by individual IPS server processes, and individual Planning Space applications.
Note: if the IPS Server is running add-in services, such as the PlanningSpace Data Connector module, then application metric data will be shown for these add-in services.
The coloured bars located at the right of each graph show the current values of the performance metrics, for each server machine.
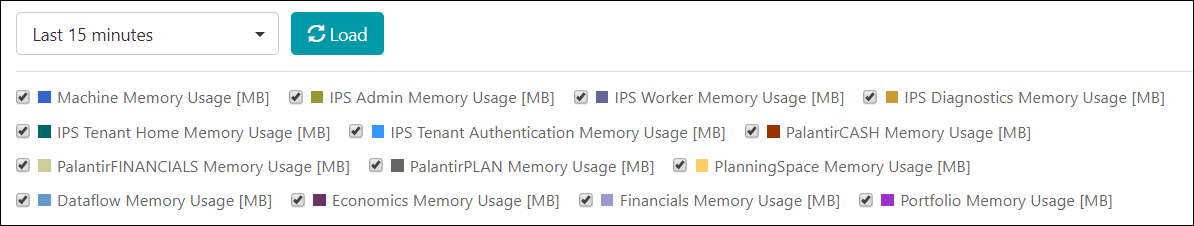
Each graph shows historical data for the time range as selected by the drop-down menu at the top left - ranging from the last 15 minutes to 24 hours, or a custom time range. Click the 'Load' button to load the new data into the graphs. The number of days of stored performance data is controlled by the 'Monitor History' setting (default 30 days); note also the 'Sampling Interval' setting which sets the time interval for sampling the performance monitors (default 30 seconds) (see Service configuration).
The key to the graphs appears above the graphs, explaining the metrics that are displayed. Use the tick boxes in the key to show or hide the data for the individual metrics:
Click the expand icon ![]() on any graph to get an expanded view
(and click the X icon to close it).
on any graph to get an expanded view
(and click the X icon to close it).
| Metric category ('metric group' in the API) |
Machine metrics | IPS server usage metrics | Application usage metrics | API metric group ID |
|---|---|---|---|---|
| CPU | Machine CPU Usage (%) |
IPS Admin CPU Usage (%)
IPS Worker CPU Usage (%)
IPS Diagnostics CPU Usage (%)
IPS Tenant Home CPU Usage (%)
IPS Tenant Authentication CPU Usage (%)
|
PalantirCASH CPU Usage (%)
PalantirFINANCIALS CPU Usage (%)
PalantirPLAN CPU Usage (%)
PlanningSpace CPU Usage (%)
Dataflow CPU Usage (%)
Economics CPU Usage (%)
Financials CPU Usage (%)
Portfolio CPU Usage (%)
|
1 |
| Memory | Machine Memory Usage (MB) |
IPS Admin Memory Usage (MB)
IPS Worker Memory Usage (MB)
IPS Diagnostics Memory Usage (MB)
IPS Tenant Home Memory Usage (MB)
IPS Tenant Authentication Memory Usage (MB)
|
PalantirCASH Memory Usage (MB)
PalantirFINANCIALS Memory Usage (MB)
PalantirPLAN Memory Usage (MB)
PlanningSpace Memory Usage (MB)
Dataflow Memory Usage (MB)
Economics Memory Usage (MB)
Financials Memory Usage (MB)
Portfolio Memory Usage (MB)
|
2 |
| Threads | Machine Thread Usage |
IPS Admin Thread Usage
IPS Worker Thread Usage
IPS Diagnostics Thread Usage
IPS Tenant Home Thread Usage
IPS Tenant Authentication Thread Usage
|
PalantirCASH Thread Usage
PalantirFINANCIALS Thread Usage
PalantirPLAN Thread Usage
PlanningSpace Thread Usage
Dataflow Thread Usage
Economics Thread Usage
Financials Thread Usage
Portfolio Thread Usage
|
3 |
| Network |
Network Usage (Kbps) Note: the display graph scale has a fixed vertical range with maximum 100,000 Kbps. This limit does not affect the downloadable monitor data. |
4 | ||
| Disk usage |
Disk Read Time (%)
Disk Time (%)
Disk Write Time (%)
Free Space (%)
Idle Time (%)
|
5 | ||
| Disk bytes |
Average Disk Bytes/Read (Kb)
Average Disk Bytes/Write (Kb)
Average Disk Bytes/Transfer (Kb)
|
6 | ||
| Disk time |
Average Disk sec/Read (Millisecs)
Average Disk sec/Write (Millisecs)
Average Disk sec/Transfer (Millisecs)
|
7 | ||
| Disk queue length |
Average Disk Queue Length
Average Disk Read Queue Length
Average Disk Write Queue Length
|
8 |
IPS Server Monitor - Tenant user access
For version 16.5 Update 13 and later: the service setting 'Enable Server Monitor' (with default enabled) can be used to disable the server monitor processes. This means that all back-end data collection and API endpoints will be stopped; and the Server Monitor user interfaces will be removed.
An alternative access endpoint for the Server Monitor interface is provided for tenant users. The data available are the same as in the previous section.
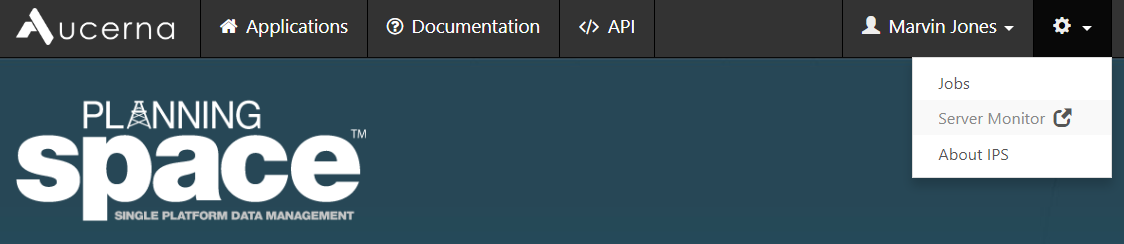
Tenant access is available:
- in the tenant web interface, click the cogwheel icon button in the top menu, and select 'Server Monitor' (see screenshot above);
- use the direct URL 'http://{server FQDN}/{TENANTNAME}/monitor' (or 'https' if enabled);
- in the Planning Space client program, running on a client machine, select the 'Administration' workspace, and click 'Server Monitor' in the top menu.
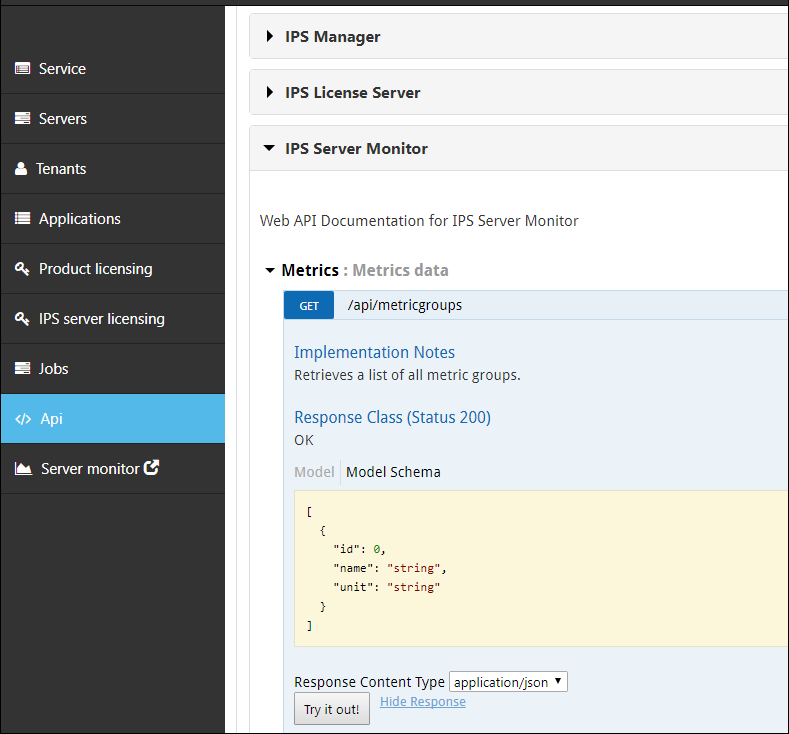
API access to IPS Server monitor data
The IPS Manager API provides access to IPS Server performance data, that is the same data which are presented graphically by the IPS Server monitor.
For API reference information, and live testing of API calls, see the 'Api' screen of IPS Manager (at the URL 'https://{SERVICEADDRESS}/admin/#/api'). See the screenshot below.
You can also access reference information for the Server Monitor API in the IPS Admin API Guide.
For information about tenant user API access, see the IPS Server Monitor Tenant API in the Planning Space Web API Guide.